California DHCS
By Fuselab CreativePublic-sector healthcare reporting, data visualization, and dashboard organization.
Hierarchy, dense data, and operational decisions. Explore selected examples and the different contexts behind them.
Hierarchy, dense data, and operational decisions.
5 project entriesAn owner-curated presentation order, not a measured agency review score.
 Pick 1: Fuselab Creative
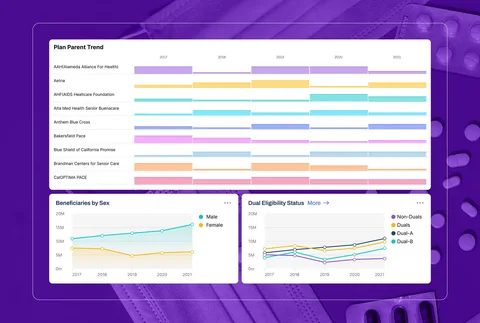
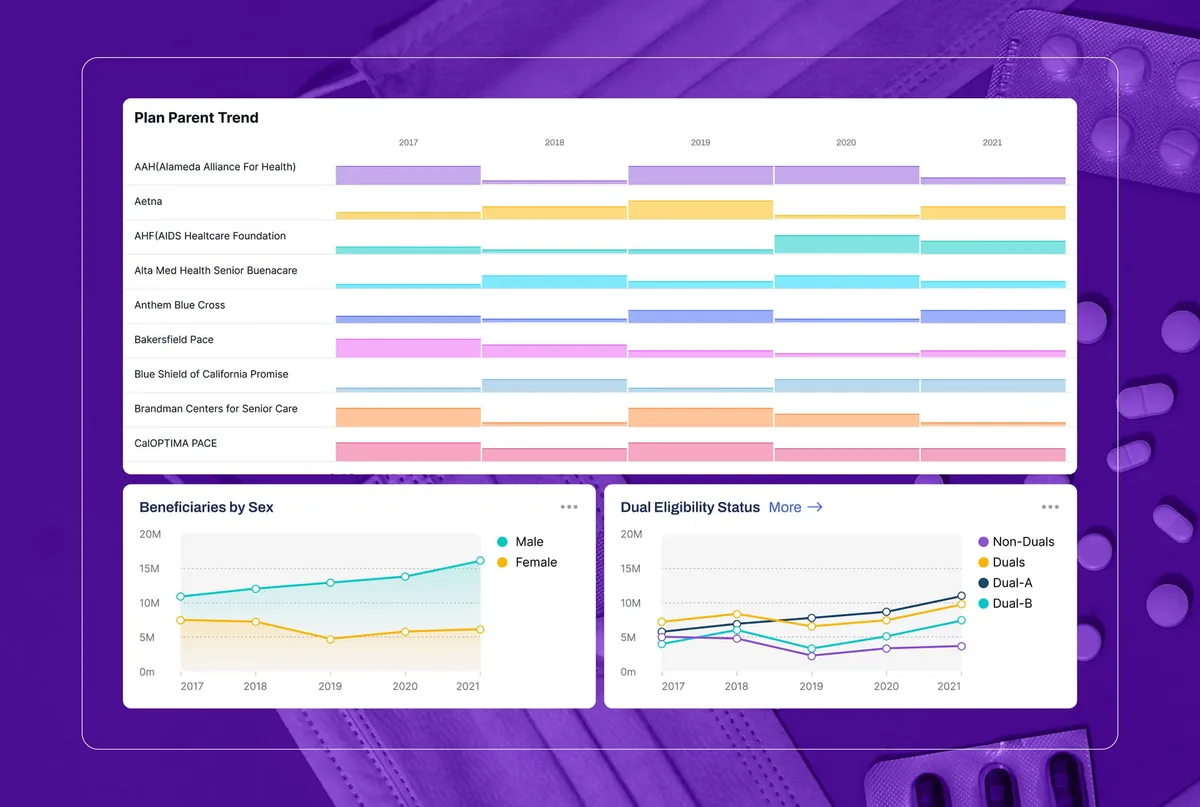
Healthcare reporting dashboards, filtering, and data visualization.
Public-sector healthcare reporting, data visualization, and dashboard organization.
Case study · View original case study
 Pick 2: Neuron
Operational KPIs, historical comparisons, and administrative dashboards.
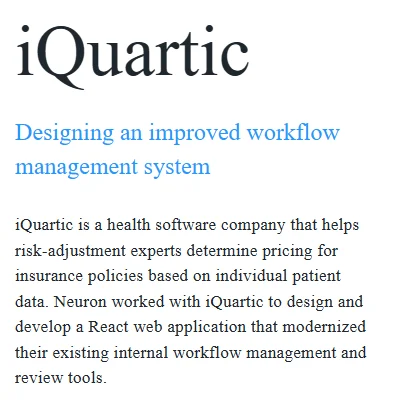
Medical-coding/risk-adjustment workflows, dashboards, and design-system consistency.
Portfolio highlight · View source project
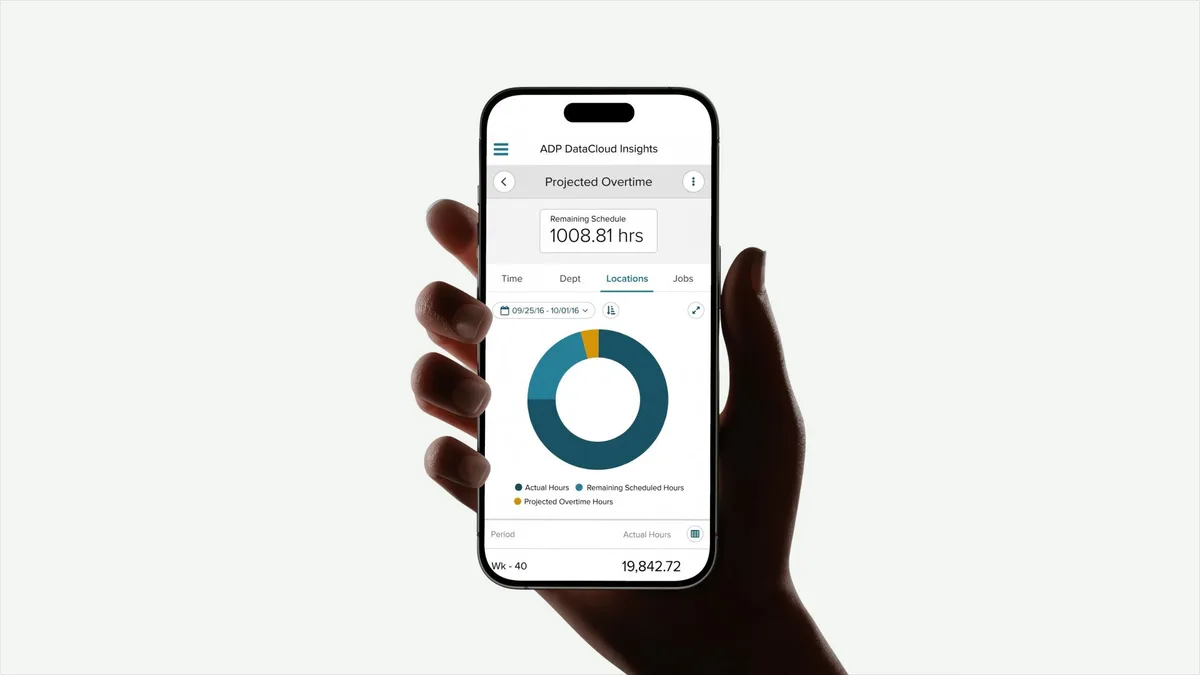
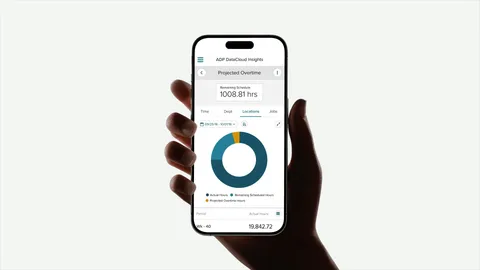
Mobile workforce analytics, charts, and integration into an existing application.
Portfolio highlight · View source project
Specialist engineering information, dashboards, and application redesign.
Portfolio highlight · View source project
 Pick 5: Instrument
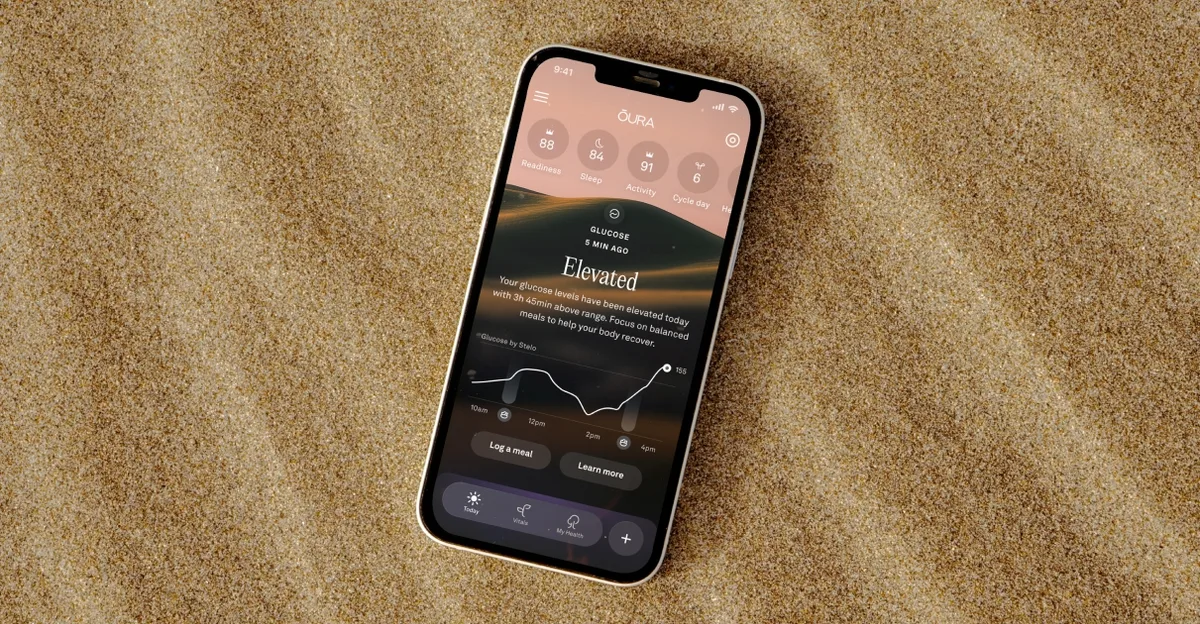
Health-data summaries, focused metrics, and interactive trend exploration.
An app redesign that makes daily health signals and long-term trends easier to read and act on.
Portfolio highlight · Released product (agency-reported) · View source project
Start with the decision, then examine the data. These picks span public healthcare reporting, medical administration, workforce analytics, engineering data, and personal health metrics. Look for how each interface establishes hierarchy and helps a reader move from an overview to a specific task.